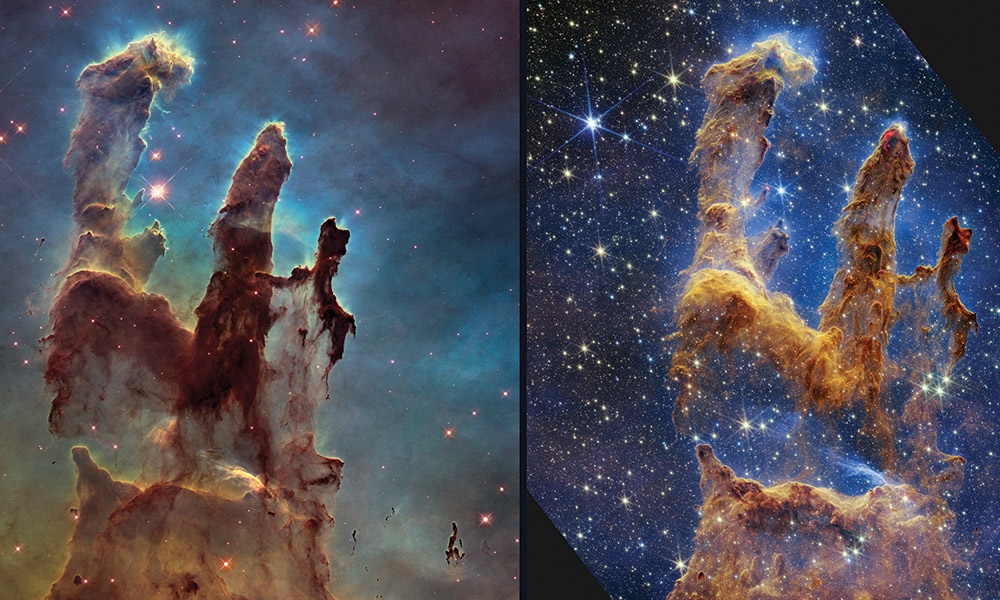
When we look at beautiful images of the Pillars of Creation, the Tarantula Nebula, or the famous Hubble Ultra Deep Field filled with more than 10,000 distant galaxies, do they really look like that? If we traveled vast distances and saw them with our own eyes, up close, would the Ring Nebula be a rainbow ring of color? Would the Butterfly Nebula look like a pair of vast, technicolor wings?
Unless we are talking about images of stars or other extremely bright objects, the answer is usually no; the universe is by and large a very dim place to the naked eye. But that is not the whole story. The dazzling arrays of colors we see in many space images are not fakery, but often the result of careful consideration of the need to translate scientific data accurately in a digestible format, the hope of conveying the importance of new astronomical insights to the public, and the very human desire to make images aesthetically appealing.
To understand the choices made in colorizing space images fully, we need to understand how modern telescopes capture images of space in the first place. Optical telescope cameras consist of large arrays of tiny pixels. During an exposure, photons hitting the pixels are converted to electrons and holes, from which voltages are measured. Those voltage measurements are then digitized and stored electronically, representing the number of photons that hit the pixel array during the exposure period. This provides accurate information for the apparent brightness of objects in the field of view.
Images built from this brightness information can be stretched—manipulating the distribution of pixel brightness values to spread out the dark values and compress the highlights—to draw out details from the darkness, but they say nothing about color. Color information is obtained by observing a scene repeatedly with different filters, which absorb certain colors of light while allowing others to pass through. To render a scene in color close to what we would perceive, known as true color, optical telescope cameras can use red, green, and blue filters separately. The different color images produced are then combined into a composite image that aligns closely with what the eye would perceive.
Rarely does the public see images presented in true color, though. This is in large part because telescopes are able to look at parts of the electromagnetic (EM) spectrum far beyond what humans can perceive. Joe Depasquale and Alyssa Pagan of the Space Telescope Science Institute are behind many of the US National Aeronautics and Space Administration (NASA)/European Space Agency (ESA) Hubble Space Telescope (HST) and NASA James Webb Space Telescope (JWST) images that continue to captivate the public. Pagan says that there is a well-established methodology for dealing with the wider EM spectrum: “In terms of assigning color, we generally do some standard chromatic ordering because it has the most scientific value and meaning in it, and usually also gives you aesthetic images.”

A small section of the Rubin Observatory’s view of the Virgo Cluster, featuring two prominent spiral galaxies, three merging galaxies, galaxy groups both near and distant, stars within the Milky Way, and much more. Photo credit: NSF–DOE Vera C. Rubin Observatory.
Chromatic ordering simply means that images taken with a filter to reveal the shortest wavelengths are colorized blue, slightly longer wavelengths are assigned to green, and the longest wavelengths are red. There can be more than three filters—JWST’s NIRCam has 29—but each must be assigned a color of the visible spectrum in wavelength order to build a composite color image.
The JWST sees between 600 nm and 28,500 nm, mainly in the infrared (IR) far beyond wavelengths that humans are capable of seeing (380–750 nm). And although HST sees the visible spectrum, its range is also much greater, encompassing ultraviolet (UV), visible, and IR light between 90 nm and 2,500 nm. Therefore, the vibrant colors presented in HST and JWST images are often not at all what would be seen by the human eye, which has led to some mistrust. “There is an audience of people that think this is fake, just because it’s representational,” adds Pagan. “But when you’re talking about ultraviolet or infrared, how else are you supposed to represent it?”
Another visualization challenge is in trying to showcase a feature of particular scientific interest while still representing space color in as authentic a way as possible. “If you take the Hubble’s Pillars of Creation image, for example, it’s made up of three narrowband filters—oxygen, sulfur, and hydrogen emission,” explains Depasquale. “The sulfur and the hydrogen are both red, so that would make a very red image with some cyan for the oxygen. Being flexible about how you color the data, but maintaining chromatic order, is really what makes the images pop and allows you to pull more detail out.”
More subjective, artistic interpretation comes into play when applying the finishing touches to an image before public consumption. “Whatever the discovery is that we’re trying to communicate, it will push how we treat that image in the color separation and the contrast,” reveals Pagan. “We will even stray from chromatic order sometimes, if we feel abandoning it helps see detail in a specific filter.”
This ongoing quest to render the cosmos in ever more revealing ways continues with new instruments coming online. A ground-based optical observatory jointly funded by the US National Science Foundation and the US Department of Energy, the Vera C. Rubin Observatory in Chile, recently joined the likes of HST and JWST in delivering stunning images of the night sky. Housing the largest (3,200 MP) astronomical camera ever built, the Rubin will scan the entire southern sky from UV to IR wavelengths (330 nm to 1060 nm) for 10 years in exquisite detail, detecting transient astronomical events in the process and potentially revealing new information about dark matter and dark energy.

The LSST Camera is installed in the Simonyi Survey telescope. Photo credit: RubinObs/NSF/DOE/ NOIRLab/SLAC/AURA/T. Lange.
One of the Rubin’s earliest images provided a total view of the Virgo Cluster, showcasing the observatory’s huge potential as a discovery tool. Made from more than 1,100 individual images, the Virgo image includes about 10 million galaxies, just 0.05% of the approximately 20 billion galaxies the Rubin will capture over the next decade. “With the Virgo image, people suddenly had this very deep field, just full of stuff,” recalls Rubin Observatory Commissioning Scientist Robert Lupton. “Looking at it, the image was a real distraction from getting real work done, and I think most of the scientists on the team discovered they had lost an hour or two of their lives exploring that image!”
One of the most striking elements of the Virgo image is how it differs in richness of color compared to earlier deep-field images, such as the famous Hubble Deep Field image captured in 1995. “At the time, they saturated everything to white, with some hints of color in the background,” says Lupton. The reason to make bright stars white harkens back to the days of photographic plates which would become completely saturated by bright objects. In more modern times, this has led to what Lupton describes as “weird” colorization, where faint objects have color, but brighter objects gradually become whiter in an inconsistent way.
Lupton and colleagues found a solution, applying a nonlinear mathematical trick that retains structures that are faint, and flattens them out to offer large dynamic range, and then preserves the colors by taking the ratio of the filter bands. “Stars have colors that tell you how hot they are, so we worked hard to preserve the information content and color,” Lupton explains. “You can even access data processed deliberately to preserve the colors straight from the pipelines—no human has touched this.”
While successfully processing and colorizing these UV, optical, and IR wavelengths from the likes of HST, JWST, and the Rubin Observatory is a significant feat, the journey through the EM spectrum presents even greater challenges. For example, at the short wavelength, high energy end of the spectrum, X-rays do not penetrate Earth’s atmosphere, meaning they can only be observed from space. Even then, because of their ability to penetrate matter, a regular observing strategy would see the X-rays simply absorbed by the telescope’s mirrors. That is why NASA’s Chandra X-ray Observatory has mirrors made of iridium (the best reflector of X-rays) and shaped like barrels, to ensure X-rays graze them at the shallowest of angles in order to be gently guided to a focal point where they are detected and measured by science instruments.
Outside of actually capturing the photons, the colorization process for Chandra’s data is similar to that for optical telescopes, with the convention that low, medium, and high X-ray energy bands are shown as red, green, and blue, respectively, and then brought together in a composite full-color image. The famous Chandra Observatory image of Cassiopeia A is a great example, where bright regions display shock waves produced by the supernova remnant’s expanding shell of hot gas, whose temperature variations are represented by the different colors.

The Rubin Observatory. Photo credit: Olivier Bonin/SLAC National Accelerator Laboratory.
At the longer end of the spectrum, both photon capture and colorization are somewhat trickier, because the way data are produced in radio and millimeter-wave observatories differs wildly from X-ray or optical observatories. Long-wavelength, low-energy microwaves and radio waves penetrate the atmosphere and can therefore be picked up from the ground, but they are much harder to isolate and process. “Because the radiation has such long wavelengths—millimeters to centimeters—even large telescopes struggle to get a nice, localized detection like an optical observatory can,” explains Josh Borrow, who is a research software engineer working on the Simons Observatory, a new, ambitious millimeter-wave observatory in Chile.
This is a prime reason why most radio and millimeter-wave observatories explore the heavens in an unconventional way. Optical observatories contain CCDs that generally point directly at an object for a predetermined exposure time, building up charge as they are hit by more and more photons. Radio and millimeter-wave detectors, however, are more like tiny thermometers that are heated by incoming waves as the dishes scan across the sky, delivering temperature as a function of time, Borrow explains. “These detectors are usually sensitive to instantaneous power, like a light-dependent resistor, rather than cumulative power, like a camera sensor,” he says. “So, we need to do an extra step where we remove this natural time axis from our data to back out what a static image of the sky would be—which is completely different to the way most observatories work.”
Even with this complicated observation strategy, the final images from radio and millimeter-wave observatories are, more often than not, less clear than those from optical observatories. “The analogy I use with the radio images is that everybody else is getting high-glam Kardashian photos, and we’re stuck with the blobby ones,” says Bill Saxton, animator/illustrator at the US National Radio Astronomy Observatory, which is responsible for several radio and millimeter-wave observatories, including the Very Large Array (VLA), the Atacama Large Millimeter/Submillimeter Array, and the Green Bank Telescope. “I’ve got a term: Learn to love the blob.”
Where researchers most certainly do not love the blob is in observations of the cosmic microwave background (CMB). The CMB is a faint background glow of radiation that pervades the entire cosmos. It was released about 380,000 years after the Big Bang, when the opaque, primordial plasma that made up the universe became diffuse enough that matter and radiation could go their separate ways, making space transparent. It is therefore the universe’s first light—anything preceding the CMB’s release can never be directly observed (except perhaps neutrinos).
Observations of the CMB since NASA’s Cosmic Background Explorer ended operation in 1993, have delivered ever-more fine-grained, i.e. less blobby, CMB maps featuring seemingly random hot and cold spots that vary by just one part in 100,000 everywhere on the sky. The most well-known map was produced by ESA’s Planck satellite in 2013. Now, among other aims, Simons Observatory scientists are building an even more detailed map of the CMB containing extremely faint signals that they hope can prove or disprove physicists’ understanding of the early evolution of the universe.

Composite image of the Helix Nebula, featuring X-rays from the Chandra Observatory, optical light from HST, infrared from the ESA’s European Southern Observatory, and UV from NASA’s Galaxy Evolution Explorer. Photo credit: X-ray - NASA/CXC/SAO/Univ Mexico/S. Estrada-Dorado et al.; UV - NASA/JPL; Optical - NASA/ESA/STScI (M. Meixner)/NRAO (T.A. Rector); IR - ESO/VISTA/J. Emerson; Image Processing - NASA/CXC/SAO/K. Arcand; Illustration - NASA/CXC/SAO/M. Weiss.
“We transform the brightness of the sky into a temperature offset from the CMB average,” says Borrow. “As you’ve probably seen in the Planck map, the standard CMB, style colors are blue is colder and red is hotter, though obviously in temperature terms this is the wrong way round—a star glowing blue is hotter than a star glowing red—which is always an objective consternation among people.” Though somewhat abstract in their appearance, Borrow says that the great thing about CMB maps is that what you see is what you get. “When you look at a CMB map, it’s a compressed JPEG,” he continues. “But it’s the exact same data the scientists are using to look at the power spectrum.”
Although seeing the same images that scientists are using can be exciting for the general public, sometimes images made purely for public consumption can have even more impact. In particular, color really starts to make an impression on people when data from different observatories, scanning the sky at vastly different wavelengths, can be compared or all brought together, using color to highlight contrast between vastly different features and processes.
“Sometimes, I’ll have files from multiple radio telescopes that are ours to combine together to show something,” says Saxton. “But oftentimes it’s combined with optical, infrared, all the frequencies—it can vary wildly.” For example, Saxton combined and contrasted VLA (radio) and HST (optical) images of the W50 Manatee Nebula to startling effect, with the radio image revealing an otherwise-hidden 20,000-year-old supernova remnant nearly 700 light years across. “I intentionally deviated from my general follow-the-wavelength rule and chose blues to color W50, so the invisible radio data looked more like a manatee,” he adds.
The Helix Nebula is another example of a composite image with real visual impact to capture the public’s imagination. Scientists brought together X-rays from the Chandra Observatory, optical light from HST, IR from ESA’s European Southern Observatory, and UV from NASA’s Galaxy Evolution Explorer in one composite image of the planetary nebula to show the epic detail of what happens when a star like our sun runs out of fuel to form a white dwarf.
No human could ever dream of seeing these cosmic phenomena in such kaleidoscopic glory, because in the visible spectrum this is just not how they appear. But does that really matter? When the purpose of colorization is the same as the purpose of astronomy—to help understand the universe and our place within it—bring on the color!
Benjamin Skuse is a science and technology writer with a passion for physics and mathematics whose work has appeared in major popular science outlets.