Christina Schallenberg, a biological oceanographer at CSIRO, Australia’s national science agency, remembers one of her best moments from a research trip. She was aboard an icebreaker ship anchored somewhere in the icy white expanse of the frozen Southern Ocean. She heard some bird calls and figured there must be penguins around, before happily realizing how routine this had become for her.
“You get so immersed in that beautiful environment that it becomes normal to you,” says Schallenberg.
But there’s little normal about the Southern Ocean, which, when it freezes in the austral winter, doubles the size of Antarctica. Large parts of it remain unexplored because of its remoteness and harsh weather. But, despite knowing little about it, we have a lot to thank it for. Even though it spans only 6% of the global ocean surface, it has been estimated to account for 40% of the anthropogenic carbon absorbed by the oceans, thereby considerably slowing climate change.
Researchers don’t fully understand how the Southern Ocean sinks so much carbon or whether it will continue to do so in the future. In fact, carbon dynamics are little understood even in the better explored regions of the oceans.
Carbon flux is closely linked to nutrient cycling in the oceans, beginning with phytoplankton, the microscopic algae that float on the surface. Like plants on land, these photosynthetic microbes are primary producers and sustain the marine food web. “With primary production, phytoplankton pull carbon dioxide out of the atmosphere and into the surface ocean,” says Eric Hochberg, a coral reef ecologist at Arizona State University. When they sink, they take that carbon into the deep ocean.
Whether phytoplankton can proliferate in a region in the oceans, and remove carbon from the atmosphere, depends on whether there are sufficient nutrients. Nitrate, for example, is the most important nutrient for marine primary production as the phytoplankton need it to build themselves. “We are interested in measuring how much nitrogen is coming in and how much nitrogen we are losing in the ocean,” says Mariana Bif, a chemical oceanographer at the University of Miami.
While satellites provide important clues into how the oceans are doing, they can see very little of the vertical movement of marine nutrients. Sunlight fades quickly with depth, with almost all regions under 200 m permanently in the dark. Moreover, satellites cannot measure marine nutrients directly; instead, they rely on inferences from estimates of phytoplankton or pigments they produce, like chlorophyll.
The information gap between the surface and deeper regions of the oceans is now being filled by data from nearly 4,000 autonomous profiling floats, devices that dive in the oceans and collect oceanographic data. Part of the Argo network, an international collaboration of oceanographers, the floats are spread around the global oceans and have been monitoring ocean health since 2001. While they were previously designed to track parameters like salinity and temperature, starting in 2016, some of them now also feature biogeochemical sensors (BGC-Argo).

Mariana Bif and a colleague deploying a BGC-Argo float in the Bay of Bengal. Photo credit: Sudeesh Keloth.
Floats come in different models from a few manufacturers, such as Sea-Bird Scientific and Teledyne Webb, but they are typically four to five feet in length and house sensors in pressure-resistant aluminum tubes. A hydraulic pump moves oil in or out of an external compartment to control the buoyancy of the float, which in turn determines the depth the float stays at.
Capable of diving to a depth of 2,000 m, Argo floats have become a more practical and affordable alternative to sending a scientific crew on a research vessel for many use cases. “Earlier, we would need to go to the ocean, and we could only take a couple of measurements from a couple of depths,” says Bif. Research cruises are expensive, and not all parts of the oceans are accessible year-round. “We would have only a snapshot of how chemistry and biogeochemical cycles worked in the ocean, and it required an extensive amount of effort and lab work to achieve it,” says Bif.
Now, the BGC-Argo floats generate large amounts of biogeochemistry data by replacing wet chemistry experiments onboard research vessels with sensors that work without a break.
The floats spend most of their lifecycle at 1,000 m. Every 5-10 days, they sink to 2,000 m. On their way back up, the floats profile the entire water column and, unless obstructed by sea ice, travel all the way to the surface for a few minutes to a few hours before returning to 1,000 m. When a float reaches the surface, an antenna on top of it transmits data to Earth observation satellites. Placed below the antenna is a conductivity, depth, and temperature sensing instrument that gathers key physical parameters. For floats that are part of the BGC-Argo program, additional sensors include a semiconductor sensor for measuring ocean water pH and a suite of optical sensors for other biogeochemical properties.
An important biogeochemical marker of interest is dissolved oxygen, which indicates the health and productivity of marine ecosystems. An optical oxygen sensor includes an oxygen-sensitive coating whose luminescence decreases in proportion to the dissolved oxygen concentration. Many Argo floats outside the BGC-Argo program pack this sensor too, since oxygen is of interest to physical oceanographers as well.
Among biogeochemistry-specific sensors, a nitrate sensor measures inorganic nitrate concentrations by emitting ultraviolet light and measuring how much of it is absorbed by the water column. “But there’s lots of other material in seawater that also absorbs at similar wavelengths as nitrate,” says Rob Ellison, vice president of research and development at Sea-Bird Scientific. The float manufacturer also makes optical sensors for a large part of the BGC-Argo fleet.
Bromide, for instance, is a strong absorber of ultraviolet and is present across the oceans. Thus, it interferes with nitrate measurement, especially in the open oceans where nitrate concentrations are low. “We have algorithms and calibration processes that correct for bromide and other dissolved organic material that absorb ultraviolet light,” says Ellison.

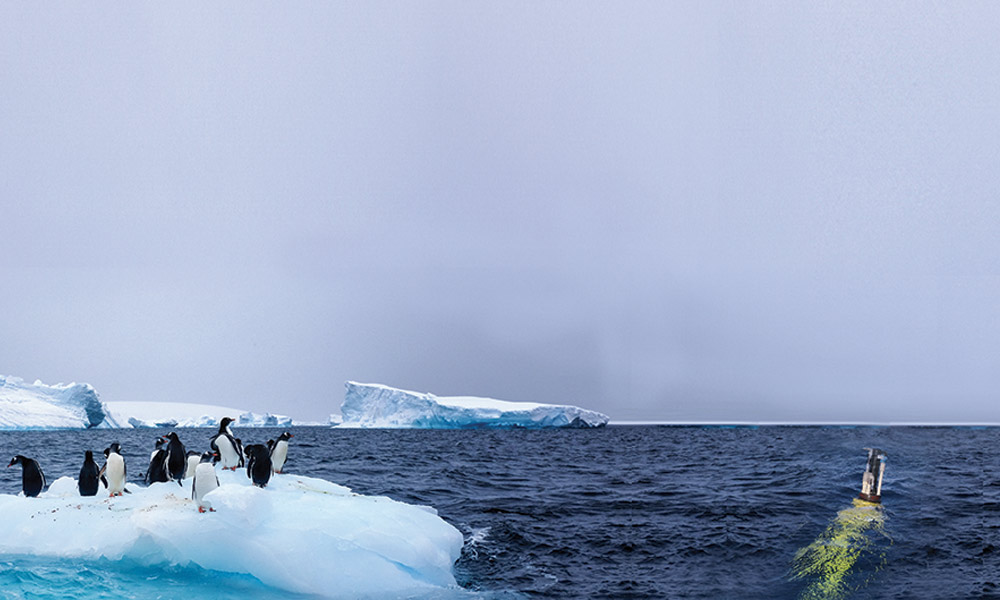
Deploying a BGC-Argo float from RSV Nuyina. Photo credit: Pete Harmsen, Australian Antarctic Division.
A backscattering sensor measures the amount of phytoplankton, microbes, and other suspended particles in water. “The amount of light that’s scattered gives you an indication of how many particles are in the way,” explains Anna Hickman, an oceanographer at the University of Southampton. To zero in on phytoplankton, a fluorescence sensor measures chlorophyll. Since this pigment indicates photosynthetic activity, the sensor detects the photons emitted by the chlorophyll in response to blue light.
Additionally, a radiometer captures the downwelling irradiance, or how deep sunlight of different wavelengths travels. This reveals how much light is available for primary production and the number of suspended particles at different depths. The irradiance sensor also improves the estimation of chlorophyll. “This is because the thing that most affects how light disappears in the ocean is how much chlorophyll there is,” says Schallenberg.
Thanks to the BGC-Argo floats moving up and down the global oceans, the data on ocean nutrient levels now spans across oceanic regions and seasons and throughout the 2,000 m water column that the floats cover. “Now we can know what’s going on in every meter of depth and constrain variability during seasons and in different layers of the water column,” says Bif.
With the wealth of spatiotemporal nutrient data from floats, researchers are beginning to get a better hold on how nutrients move in the ocean. “There’s enough data on these nutrients that it can be assimilated into machine learning and AI techniques,” says Bif.
In a 2025 study published in Global Biogeochemical Cycles, researchers used machine learning on BGC-Argo data to calculate carbon sinking in the Southern Ocean. They found that biological activity resulted in the export of 3.91 billion metric tons of carbon each year from the atmosphere to ocean depths between 2004 and 2022. Not only is the Southern Ocean sinking more carbon than previously estimated, but its ability to act as a carbon sink has increased over the years.
Nutrient data from the floats could also divulge insights into aspects of marine nutrient cycles that the floats can’t capture. In another 2025 study, Bif and a colleague used a statistical approach to repurpose nitrate data collected by BGC-Argo floats to estimate nitrite and thiosulfate levels. These are intermediate compounds produced by microbes in oxygen-deficient regions as they strip nitrate and sulphates of their oxygen atoms. By translating rich spatiotemporal data on nitrate into equally rich data on these other molecules, this method could open up unprecedented insights into marine nutrient cycles.
Nutrients are important in large part because of how they drive marine ecosystems. “It’s really important to know what’s using them and that’s what satellites give us,” says Hochberg. Ocean color satellites, for instance, capture the reflectance and color of the ocean surface in great detail. While we imagine the ocean waters as pristine blue, they can often range from hues of red and brown to green, and even milky, when particular plankton or sediments accumulate on the surface. Looking at the ocean color allows scientists to determine which plankton dominates a region on the ocean surface.
Plankton, Aerosol, Cloud, ocean Ecosystem (PACE), a NASA mission launched in 2024, takes these inferences a step further with the first hyperspectral imaging instrument dedicated to ocean color. “Unlike previous ocean color satellites that capture a couple of blues, greens, and reds, it measures a continuum of color from the ultraviolet all the way into the near infrared,” says Jeremy Werdell, NASA oceanographer and project scientist for PACE. It allows researchers to identify which phytoplankton communities are present, instead of just detecting phytoplankton.

Winter bloom of a phytoplankton species with its chlorophyll content visible as swathes of green in the Arabian Sea. Photo credit: NASA/PACE Satellite.
This is valuable information on nutrient flux on the surface because different phytoplankton use nutrients differently. “It’s still a proxy measurement,” says Werdell, “but it can help better understand what’s going on, where it’s going on, and why it’s happening now.” Knowing the phytoplankton community composition also connects what’s happening on the surface to the deep ocean. “Since the various phytoplankton come in different shapes and sizes, they sink at different rates,” explains Werdell.
Data from PACE and other ocean color satellites could guide when and where to deploy more floats. “If the PACE data shows an algal bloom happening in a certain location where there’s not a lot of monitoring equipment, scientists can use that information to go and deploy in situ instruments,” says Ellison.
Conversely, float data could improve satellite inferences of marine nutrients. For instance, ocean color satellite missions require calibration that validates what the satellites see with in situ measurements. Argo floats, which provide a much-expanded set of in situ measurements, have been proposed as a way to enhance the calibration of PACE. “Their data is really valuable for us to understand if what we’re deriving from the satellite is actually what’s being seen at the sea surface,” says Werdell. These insights, he adds, can be used to re-tune the PACE algorithms that convert color into biogeochemistry.
Monitoring ocean color has some immediate benefits. Tracking changes in the plankton community could predict harmful algal blooms and help fisheries avoid them. Likewise, tracking nutrient flux with in situ optical sensors could help fisheries identify if they are going to be at risk if the nutrient supply diminishes in a particular region. “For countries that can’t afford to send research vessels into their coastal regions, cheaper optical sensors on floats can be a game changer,” says Hickman.
Another huge societal concern is marine heatwaves, which are prolonged periods of higher-than-typical water temperatures that often cause widespread marine mortality. These events intensify the stratification of different layers, preventing nutrients from reaching the surface. “As the surface warms, the barrier between the warm surface water and the colder water at depth is going to get stronger,” says Hickman. Marine heatwaves are becoming more frequent and lasting longer than before. Consequently, the nutrient supply to the surface is predicted to decrease in large parts of the ocean, which, in turn, is likely to impact the marine food web.
But it’s hard to predict precisely how marine nutrient cycles will change as the oceans continue to get warmer. Many physical factors, such as ice cover and the availability of light, have a knock-on effect, as they influence how many nutrients are taken up. “There are different predictions about changes in the temperatures and the mixing in the ocean, and those are predicted to be linked to changes in the nutrient supply,” says Hickman. But, she adds, we can’t yet predict the details of where and how these changes will occur, or how they will affect marine primary production.
As oceanographers deploy more floats in the coming years, and with more data from existing floats, researchers will have long-term data on the distribution and cycles of different marine nutrients. Combined with data from the satellites, the sensors on ocean floats could yield new insight on many of the ocean’s mysteries. The most critical of these would be mechanistic insights into marine nutrient cycles and how they shape the oceans’ impact on and response to climate change.
Sachin Rawat is a freelance science writer based in Bangalore, India.