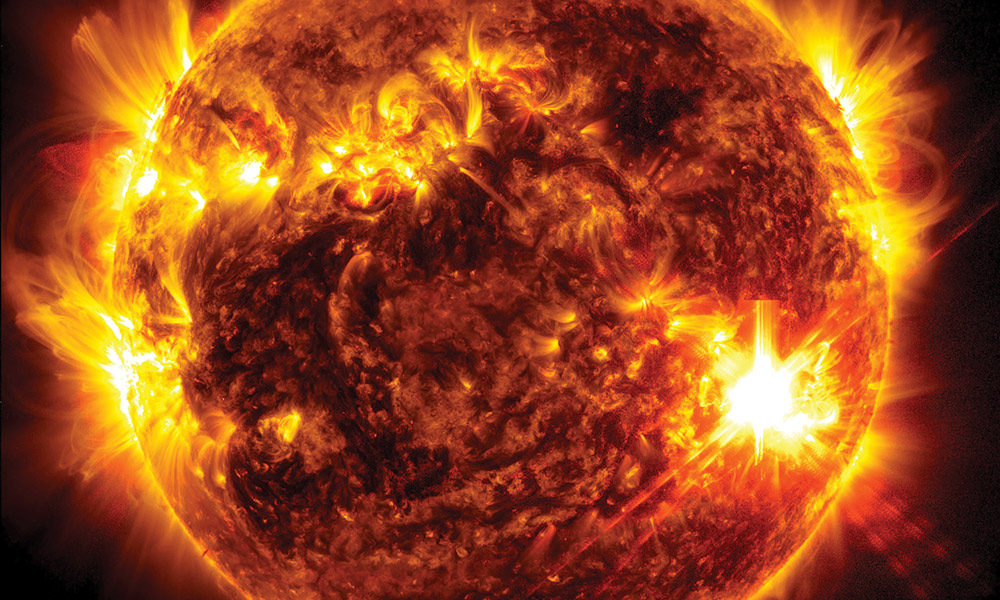
The Carrington Event was the most powerful solar storm ever recorded. Named after Richard Carrington—one of the British astronomers who observed a very bright solar flare associated with the storm—it is largely remembered for bringing people out onto the streets to witness the associated beautiful aurora, and for some fleeting effects on telegram services. But that was 1859. If a powerful solar storm were to occur today, Lloyd’s of London estimates the associated harm would cost the world as much as $9.1 trillion, equivalent to 1.4% of global GDP. That is because modern society is far more vulnerable to the high-energy particles and geomagnetic effects a solar storm can inflict upon Earth.
They can induce massive currents through high-voltage power lines, impairing and causing failures in the power grid. Solar storms risk disruption of internet services by similarly inducing currents that can fry power-feed lines for repeaters in undersea fiber optic cables. But perhaps most troublesome is their impish influence on satellites.
Solar storms heat our upper atmosphere, causing it to expand, which then drags down low-Earth orbit satellites like those in constellations that provide internet service, messing with their trajectories. These storms can also scramble satellite electronics, causing them to lose orientation or to shut down completely. And they can ionize the upper atmosphere, distorting signals from GPS/GNSS satellites used for navigation.
All in, these solar storm-derived satellite nuisances have huge and wide-ranging impacts on everything from space walks, climate science, and weather forecasting to autonomous tractors used in precision agriculture, timestamping transactions in stock trading, and navigation for nearly every type of transportation imaginable.
Predicting when solar storms might hit has become extremely important to keeping the wheels of 21st Century life turning. Fortunately, solar activity can be monitored using surprisingly simple and traditional optical methods, and it does follow a pattern…kind of.
Our star, like many others, oscillates. Constant rotation churns the sun’s turbulent plasma, and in the process converts some of this kinetic energy into electromagnetic energy. “This dynamo process is similar to how bicycle-powered flashlights work,” explains Lisa Upton, a solar physicist at the Southwest Research Institute (SwRI), Boulder, Colorado. “Your wheel turns, and that creates a current that powers the flashlight.”
During a period called solar minimum, the associated magnetic field envelops and surrounds the sun like a regular bar magnet, with a north and south pole and well-organized field lines linking the two. But because the sun’s plasma rotates faster at the equator than at the poles, gradually over years the magnetic field lines stretch, twist, and tangle, driving the sun from a state of relative calm to a period of intense action marked by solar flares, sunspots (dark regions on the sun’s surface where the surface temperature is lower, caused by concentrations of magnetic flux), and coronal mass ejections. After this period of intense activity, known as solar maximum, the sun’s global magnetic field slowly returns to an organized, relatively calm state, but with the magnetic poles reversed. This cycle repeats ad infinitum every 11 years or so (with the sun therefore returning to its original magnetic configuration every 22 years).
“We just passed solar cycle maximum, and we’re starting to move to a quieter phase,” explains Upton. “Over the next few years, we’re approaching solar minimum, which will probably be around 2030.” Upton would know: She is co-chair of the current Cycle 25 Prediction Panel, a group of 12 heliophysicists who first convened in 2019 to figure out the intensity and timing of the cycle maximum, and when solar minimum will occur. The panel is organized by NASA, the US National Oceanic and Atmospheric Administration (NOAA), and now the International Space Environment Service (ISES).

Analyzing solar activity at a US National Oceanic and Atmospheric Administration facilty. Photo credit: NOAA/SWPC Forecast Office.
Though 1755 was designated the start of Solar Cycle 1, due to being the first cycle for which regular measurements of sunspot numbers (SSNs)—a key measure of solar activity—were reliably recorded, it was not until 1843 that the cyclical character of the sun’s magnetic activity was noticed by German amateur astronomer, Heinrich Schwabe.
It took even longer—until 1989—to convene the first Cycle Prediction Panel. The aim of that panel was to discuss the potential impact on the about-to-launch Hubble Space Telescope. The concern was satellite drag from solar activity during Solar Cycle 22, already well underway. Panels have since been organized in advance of every solar cycle, bringing together experts to attempt to build a consensus prediction of how the next cycle will shape up, based on the latest and best information from the scientific community.
A panel’s success is measured by two solar activity indices: the aforementioned systematic recording of SSNs, and radio wave energy flux in a band of wavelengths centered around 10.7 cm (referred to as F10.7 cm radio flux), which is a signal generated by free electrons in the hot, magnetized plasma above sunspots.
SSNs are recorded each day by a network of more than 80 ground-based telescopes across the world, to deliver 24-hour coverage. The reference telescope is the Zeiss Coudé Refractor (150 mm aperture) at the Specola Solare Ticinese in Locarno, Switzerland. The SSN count is done by the projection method, wherein the telescope projects an image of the full solar disk onto a white piece of cardboard, and an observer hand-draws a sunspot map from which a number is derived for the day’s count.
This antiquated instrument (built in 1957) and method calibrate the count so that more powerful, modern telescopes don’t inflate the SSN count and therefore predict much more intense solar cycles in comparison to the historical record. The Daniel K. Inouye Solar Telescope (DKIST) in Hawaii, for example, is the world’s largest solar telescope. Its huge 4 m aperture primary mirror and 1,600 actuator adaptive optics system are paired with the visible broadband imager (VBI). This instrument is a diffraction-limited two-channel imager utilizing custom-designed, large-format CMOS detectors (4k x 4k) and speckle reconstruction algorithms for mitigating atmospheric turbulence.
VBI can resolve features that are just 20 km wide—17 times smaller than the Zeiss Coudé Refractor’s limit. However, despite being leagues ahead in every way, if DKIST were capable of viewing the full solar disk (it is designed for interrogating microscopic detail of the sun) and was used to provide the daily SSN, the data would show a massive, artificial spike in solar activity compared to the last 400 years of records. Its powers are simply not needed in what is effectively a multi-century longitudinal study.
Meanwhile, F10.7 cm radio flux has been monitored daily since 1947 by a series of radio observatories maintained by Natural Resources Canada, says Mark Miesch, a research scientist at NOAA’s Space Weather Prediction Center, on whose website Panel predictions are published (and now continuously updated forecasts). “Though F10.7 cm radio flux is in some ways a more objective quantitative measure of solar activity, no other proxy can compare with the long historical sunspot record,” he adds. As a result, SSN remains the focus of solar cycle predictions.
By this index, how have the panels done in terms of predicting the intensity of solar activity? “Of the two predictions issued by the Cycle 24 Panel in 2007, one of them came within 10% of the observed maximum of 116 that occurred in 2014,” explains Miesch. “In terms of peak SSN, the other three panel predictions were off by 26 to 44%.” This level of accuracy is less than ideal when the satellite industry, for example, depends on solar cycle predictions for estimating the lifetime of their fleet.

The telescope mount assembly of the Inouye Solar Telescope features its large 4 m primary mirror, making it the most powerful solar telescope in the world. Photo credit: NSF/NSO/AURA.
The most recent panel prediction underestimated Cycle 25, both in terms of the intensity and timing of peak activity. But the panel was not alone. “Of more than a hundred Cycle 25 predictions published between 1983 and 2024, I found that only four correctly captured this cycle’s peak,” explains Floe Foxon, an interdisciplinary scientist at the University of Texas at Austin.
Part of the reason for this inaccuracy is the dearth of data. SSN has been measured for 24 full cycles, and F10.7 cm radio flux for only 7 cycles. This is nowhere near enough to properly validate models or train machine learning algorithms, and not even close to capturing longer-term prolonged grand minima or maxima that records from tree rings and ice cores, for example, hint at. Coupled with the data dearth is what appears to be an implicit random or probabilistic element to some of the sun’s processes. As a result, Foxon concludes, “Accurate prediction is probably only possible in the short term.”
However, although these factors rule out Nostradamus-like prophecies, and predictions up to now have been at best patchy, all is not lost. Even if predictions are only possible at the very start of a cycle, they are still prized by satellite companies, airlines, power companies, and even tourism agencies.
Up to now, the most promising empirical marker for these short-term predictions has been the strength of the magnetic field at the sun’s poles during solar minimum. Adam Finley of the European Space Agency’s European Space Research and Technology Centre in The Netherlands illustrates why: “If you have a lot of magnetic field at the poles during the minimum, then it means that the process has a lot to work with,” he says. “In general, you’ll get more flux emergence in the next solar cycle, and you’ll have a stronger activity cycle.”
What’s more, magnetic data from the poles are crucial in understanding the solar dynamo and thereby going beyond empirical proxies and building accurate physics-based models with predictive power: “In the last 20 years, solar dynamo models have begun to play an increasing role in solar cycle prediction,” says Miesch. “And the north and south poles of the sun play a disproportionate role in our understanding of how the solar dynamo works.”
The sun’s magnetic field has been measured for more than a century by taking advantage of a phenomenon known as the Zeeman effect wherein light emitted by an atom embedded in a magnetic field has a slightly different frequency depending on its polarization state, causing a single spectral emission line to split into multiple components.
Since the first Zeeman measurements of individual sunspots by astrophysicist George Ellery Hale in 1908-1909, ever-more-advanced instruments have been used to analyze the polarization state of these split lines, to the point where instruments like the Helioseismic and Magnetic Imager (HMI) aboard the Solar Dynamics Observatory (SDO), launched in 2010, can reconstruct the 3D vector of the sun’s full-disk magnetic field every 12 minutes.
The only problem with using polar magnetic field measurements like these is that ground-based telescopes and our current fleet of sun-directed satellites do a really bad job of covering the poles. SDO, as well as Hinode and IRIS (Interface Region Imaging Spectrograph) orbit Earth, and therefore have a restricted view of the poles. Likewise, the Solar and Heliospheric Observatory (SOHO), Aditya-L1, ACE (Advanced Composition Explorer), and DSCOVR (Deep Space Climate Observatory) all sit at Lagrange Point 1, about 1 million miles from Earth on the ecliptic plane (the flat plane of Earth’s orbit around the sun). When viewing the poles from these ecliptic positions, the pixels of an optical sensor cover a much larger area of the solar surface. Known as foreshortening, this leads to a dramatic reduction in spatial resolution per pixel and noise effects that hide the true vector magnetic field.

A high-resolution image of solar sunspots captured by the Inouye solar telescope on 11 May 2021 (not from the first science observation). The data leading to this image were acquired at a wavelength of 450 nm. Photo credit: NSO/AURA/NSF.
Of the two other extant solar-facing satellites, NASA’s Parker Solar Probe is designed to study the solar wind and corona specifically at the sun’s equator, and orbits at a small inclination of about 3.4 degrees relative to the ecliptic. It is only NASA/ESA’s Solar Orbiter, launched in 2020, that can really take a good look at the solar poles.
Solar Orbiter will gradually move further and further away from the ecliptic via gravity-assist maneuvers with Venus during its approximately 10-year mission, eventually reaching an angle of 33 degrees. Though currently only at a 17-degree tilted viewpoint, Solar Orbiter’s polarimetric and helioseismic imager (PHI) and extreme-ultraviolet imager (EUI) have already brought new insights to inform solar cycle predictions.
For instance, PHI’s magnetograms have revealed that the south pole was a mess of north and south polarity magnetic fields near solar maximum in 2025, confirming expectations, as Finley illustrates. “We saw the magnetic field at the pole being very mixed polarity, lots of different positive and negative fields, which need to cancel in order to reestablish dominant polarity as we enter the solar minimum.”
More surprising was the combined results of PHI and EUI when studying how surface plasma influences the solar cycle. Supergranules of plasma, two to three times the size of Earth, densely cover the sun’s surface. Their migration to the poles drags magnetic field along with them, with plasma and magnetic field churning back to the equator via the solar interior like a huge conveyor belt. Solar Orbiter data uncovered that this drift occurs at higher speeds (approximately 10 to 20 m/s) than scientists had expected. This suggests physics-based models that predict solar cycle intensity may require revision.
“We’re going to have better and better views of the sun’s poles every six months or so,” says Finley. “From this, we can start to build up a picture of how magnetic field is condensing and canceling, and that will then allow us to understand how the large-scale magnetic field of the sun is evolving, which is what will be driving the next solar cycle.”
Though Upton agrees that Solar Orbiter has already offered new insights and an unprecedented view of the solar poles, she feels a dedicated mission is still needed. “You’re still impaired by line-of-sight effects when you’re measuring a vector quantity,” she argues. “Solar Orbiter has been phenomenal, but we still need more: We need a solar polar mission.”
The proposed mission Upton and a large group of heliophysicists, led by SwRI’s Don Hassler, are putting their weight behind is called Solaris. If commissioned, Solaris would pass directly over the sun’s poles, eliminating the foreshortening challenges that plague ecliptic-based telescopes and even Solar Orbiter, and thereby providing the missing polar information that can help unpick the workings of the solar dynamo and potentially improve solar cycle predictions.
“Every time we go over the poles of a very large gaseous body, we discover something interesting, something unexpected, something new,” adds Upton. “The poles are the last truly unexplored region of the sun, and so to really advance heliophysics, it’s where we want to go.”
Benjamin Skuse is a science and technology writer with a passion for physics and mathematics whose work has appeared in major popular science outlets.