Spherical Aberration Interferograms
The following figures are example interferograms with their corresponding wavefront aberration and Zernike coefficients in waves.
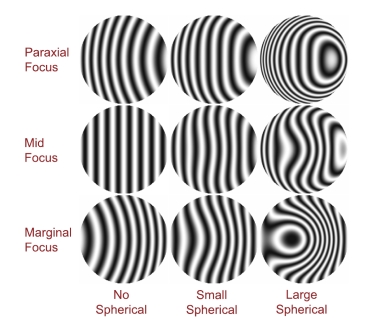
| W020=1 W040=0 Z3=1/2 Z8=0 | W020=0 W040=1 Z3=1/2 Z8=1/6 | W020=0 W040=4 Z3=2 Z8=2/3 |
| W020=0 W040=0 Z3=0 Z8=0 | W020=-1 W040=1 Z3=0 Z8=1/6 | W020=-4 W040=4 Z3=0 Z8=2/3 |
| W020=-1 W040=0 Z3=-1/2 Z8=0 | W020=-2 W040=1 Z3=-1/2 Z8=1/6 | W020=-8 W040=4 Z3=-2 Z8=2/3 |
W111=−4 and Z1=−4 for all of these interferograms.
Astigmatism Interferograms
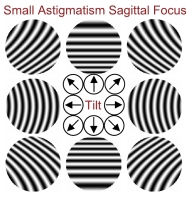 θ=Tilt orientation
Wavefront Coefficients
W020=0
W111=4 at θ
W222=−1 at 90°
| Z0=−1/4 | Z3=−1/4 |
| Z1=4 cosθ | Z4=1/2 |
| Z2=4sinθ |
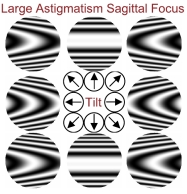
Wavefront Coefficients
W020=0
W111=1 at θ
W222=−4 at 90°
| Z0=−1 | Z3=−1 |
| Z1= cosθ | Z4=2 |
| Z2=sinθ | Z5=0 |
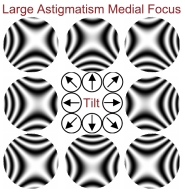
Wavefront Coefficients
W020=2
W111=1 at θ
W222=−4 at 90°
| Z0=0 | Z3=0 |
| Z1= cosθ | Z4=2 |
| Z2=sinθ | Z5=0 |
Citation:
View SPIE terms of use.
E. P. Goodwin and J. C. Wyant, Field Guide to Interferometric Optical Testing, SPIE Press, Bellingham, WA (2006).
View SPIE terms of use.